Posts

Showing posts with the label break-even inflation

Equity-Bonds Equilibrium and Inflation Uncertainties

Image
Marc Chagall - Cirque Bleu (1950-1952) Bonds-Equity correlation is positive again! The correlation between Bonds and Equity returns is moving fast these days: in a few weeks it has moved from -70% in February to +12% this week. Equity-bonds Correlation - Source: Google Finance Is this move into positive territory abnormal? What are the factors driving this change of sign? Does it mean that investors should change their Bonds-Equity allocation? Is that a warning signal for the fixed-income products? Back to the pre-2000 regime? A positive correlation between the returns of bonds prices and equity prices means a negative correlation between bonds yields and equity returns; this inverse relationship between equity prices variations and yields had been actually prevailing before 2000. As explained by Ranking & Shah Idil, in their paper “ A Century of Stocks-Bonds Correlations ”, Royal Bank of Australia, 2014 : The recent [last 14 years] period of positive co...
US Break-even inflation tracker

Image
U.S. 10-year TIPS breakeven rate rises after auction NEW YORK, March 19 Thu Mar 19, 2015 3:05pm EDT (Reuters) - The U.S. bond market's gauge of inflation expectations in the next 10 years climbed to its strongest level in more than a week on Thursday following robust demand at $13 billion auction of 10-year Treasury Inflation-Protected Securities (TIPS). http://ow.ly/KDOCF The U.S. market is sending a worrisome signal on inflation By Ben Eisen, Sept 25, 2014 NEW YORK (MarketWatch) — Investors are downgrading their expectations for inflation over the next half decade, sending a concerning signal about the pace of the U.S. economic recovery. Market-implied inflation forecasts took a nose-dive after Federal Reserve policy members suggested a more aggressive timeline for hiking key short-term interest rates last Wednesday. Treasuries Trade in Narrowest Range Since 2007 on Ukraine By Daniel Kruger  Mar 1, 2014 6:00 AM GMT+0100 The difference in y...

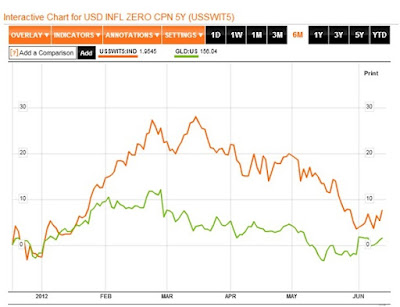
What drives gold prices these days: inflation expectations?

Image
Break-even inflation rates — i.e. the difference between nominal and real yields with identical maturity — represent a relatively crude approximation of inflation expectations. Break-even inflation rates are also found to contain useful information to forecast inflation and output growth. Together with the slope of the yield curve, break-even inflation can be seen as a predictor of future real economic activity. http://www.bloomberg.com/quote/USSWIT5:IND/chart

Sentiment de marché: en progrès mais peut faire mieux [12/20]

Image
L'anticipation de reprise économique vue dans le miroir des marchés financiers est actuellement positivement corrélée aux anticipations d'inflation. Ces anticipations peuvent elles-mêmes se mesurer dans l'écart de rendement entre les obligations 5 ans et les obligations de même maturité protégée de l'inflation. Ainsi, l' inflation implicite 5 ans  (break-even inflation) était cotée vendredi sur les marchés  américains à 1,78%, soit une croissance de près de 28% depuis son plus bas du second semestre 2010 (atteint le1er septembre 2010). Notre indicateur implicite accorde actuellement la note de 12/20 à la reprise économique américaine.